The Most Crucial KPIs for Your B2B Product
Explore essential KPIs for B2B product success, including CAC, CLV, and NPS, and learn how AI can enhance your performance tracking.
Want to measure your B2B product's success? Focus on the right KPIs.
Key Performance Indicators (KPIs) are essential for understanding product performance, user engagement, and business growth. For B2B teams, metrics like Customer Acquisition Cost (CAC), Customer Lifetime Value (CLV), Churn Rate, and Net Promoter Score (NPS) provide actionable insights to guide decisions. However, tracking these metrics in B2B is challenging due to longer sales cycles, multiple stakeholders, and complex data sources.
AI-powered tools simplify this process, automating data collection, analysis, and prediction. By integrating internal and external data, AI helps uncover trends like churn risks or feature adoption issues, enabling proactive strategies. To succeed, pick KPIs aligned with your business goals, ensure data accuracy, and refine metrics as your product evolves.
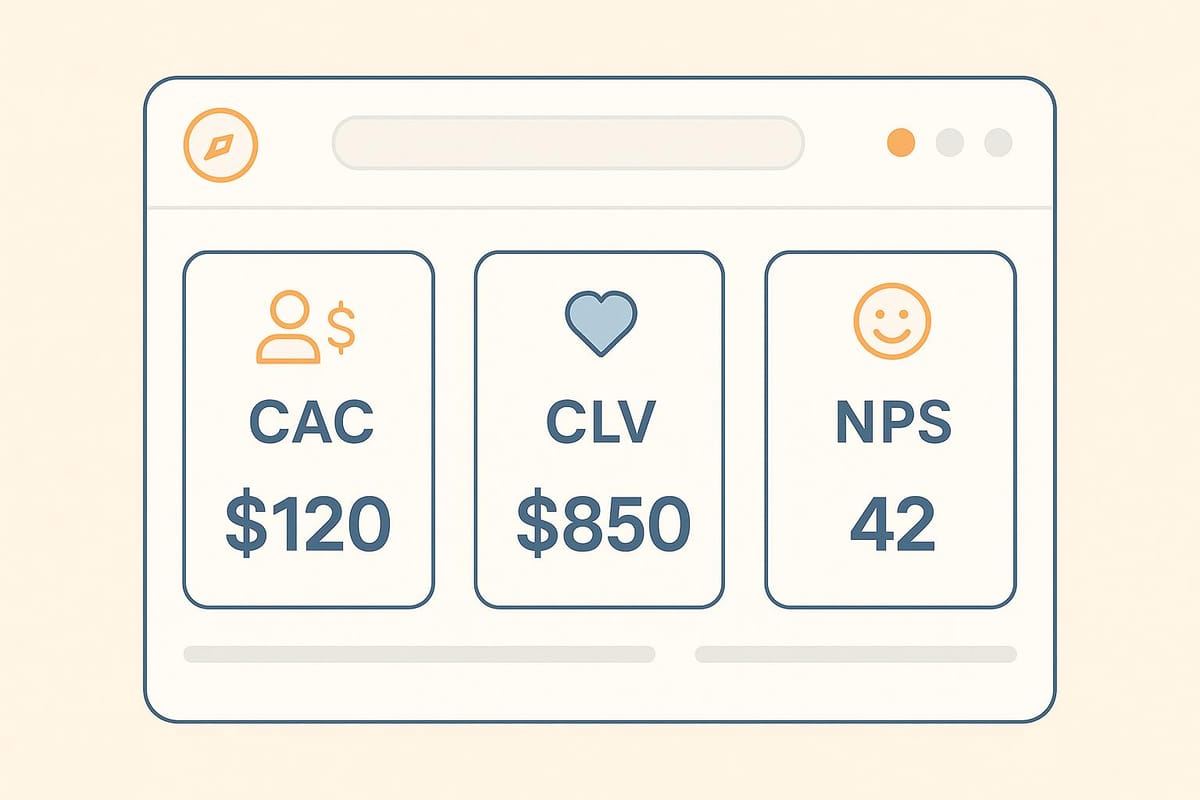
Key KPIs to Track:
- CAC: Measures the cost of acquiring a new customer.
- CLV: Estimates revenue per customer over their lifecycle.
- Churn Rate: Tracks customer loss percentage.
- NPS: Gauges customer loyalty through feedback.
- Product Usage Metrics: Includes DAU/MAU ratios and feature adoption rates.
Pro Tip: Use AI platforms like BuildBetter.ai to consolidate data, automate workflows, and gain predictive insights for better KPI management.
Mastering Performance Management & KPIs for Product Managers | #AskMeAnything
Core KPIs Every B2B Product Team Should Track
Tracking the right KPIs can be a game-changer for B2B product teams. These metrics not only highlight what's happening with your product but also help uncover the reasons behind those trends, allowing for smarter decisions. Below, we break down key KPIs that every B2B product team should prioritize, along with actionable insights to make the most of them.
Customer Acquisition Cost (CAC)
Customer Acquisition Cost (CAC) tells you how much it costs to bring in a new customer. It’s a critical measure of how efficient your sales and marketing efforts are.
To calculate CAC, divide your total acquisition costs by the number of new customers over a specific period. Monitoring CAC across different channels and campaigns can reveal where you're spending effectively and where adjustments are needed. For example, some channels might offer lower costs per customer, giving you an opportunity to reallocate resources for better ROI. Ideally, your CAC should stay well below your Customer Lifetime Value (CLV) to ensure that acquiring new customers remains profitable.
Customer Lifetime Value (CLV)
Customer Lifetime Value (CLV) estimates how much revenue a customer will generate during their entire relationship with your product. This metric is crucial for evaluating long-term business health and growth potential.
To calculate CLV, multiply the average revenue per customer by the expected customer lifespan. For subscription-based B2B businesses, you might also include factors like gross margins and churn rate to refine the calculation. A higher CLV means you can justify spending more on acquisition and retention efforts.
Segmenting CLV by customer type can offer additional insights. For instance, enterprise clients may deliver significantly higher value compared to smaller businesses. Understanding what drives CLV - such as onboarding speed or feature adoption - can help you refine both your acquisition and retention strategies.
Churn Rate and Retention Rate
Churn rate and retention rate are two sides of the same coin. Churn measures the percentage of customers who stop using your product, while retention tracks those who stick around. Together, they provide a clear picture of customer engagement and product success.
To calculate churn rate, divide the number of customers lost during a given month by the total number of customers at the start of that month, then multiply by 100. For example, if you lose 5% of your customer base in a month, that’s a direct signal of potential revenue loss.
B2B products often have lower churn rates than B2C offerings due to factors like deeper integrations and higher switching costs. Beyond raw churn numbers, consider tracking revenue churn to understand the financial impact. Segmenting churn by customer attributes, such as early feature engagement, can reveal patterns that inform retention strategies. Net revenue retention, which factors in expansion revenue from existing customers, is another key metric. If this exceeds 100%, it signals that your customer base is growing in value through upgrades or expanded usage.
Net Promoter Score (NPS)
Net Promoter Score (NPS) is a simple yet powerful way to measure customer loyalty. It’s based on a single question: “How likely are you to recommend our product to a friend or colleague?” Customers respond on a scale from 0 to 10, and they’re categorized as Detractors, Passives, or Promoters.
To calculate NPS, subtract the percentage of Detractors from the percentage of Promoters. A higher NPS indicates stronger customer loyalty. But don’t stop there - dig into the feedback. Following up on NPS responses can strengthen relationships and uncover actionable insights. Segmenting NPS by factors like feature usage or onboarding success can also help you identify trends and opportunities to improve both your product and customer experience.
Product Usage and Engagement Metrics
Usage and engagement metrics shed light on how customers interact with your product, often offering early signs of success - or trouble - before financial metrics catch up.
Metrics like Daily Active Users (DAU) and Monthly Active Users (MAU) provide a baseline for understanding engagement. The DAU/MAU ratio, often called the "stickiness" metric, shows how often users return to your product. Tracking feature adoption can highlight which parts of your product are delivering value and which might need tweaking. If certain features show low adoption, it’s a clear signal to investigate further.
Time-to-first-value is another critical metric - it measures how quickly new users achieve meaningful outcomes with your product. Faster time-to-value often leads to better retention and upsell potential. Dive deeper by analyzing session depth and frequency to distinguish between casual and engaged users.
When paired with other KPIs, product usage data becomes even more insightful. For example, if high engagement doesn’t align with customer satisfaction scores like NPS, there might be usability issues to address. On the other hand, strong performance across both engagement and satisfaction could signal opportunities for growth. Usage-based cohort analysis can also reveal patterns in early user behavior, helping you optimize onboarding and set customers up for long-term success.
Using AI and Data to Improve KPI Performance
Traditional methods of tracking KPIs often rely on fragmented data and manual analysis, leading to incomplete insights and delayed responses. AI-powered platforms change the game by automatically collecting and processing data from multiple touchpoints, offering a more complete picture of performance.
AI can handle both structured data, like subscription and usage metrics, and unstructured data, such as customer conversations, support tickets, and internal team discussions. By unifying these data sources, companies gain a clearer understanding of the factors driving their performance.
Combining Internal and External Data Sources
Many B2B product teams rely on siloed data sources for tracking KPIs - analytics dashboards for usage metrics, CRM systems for revenue data, and survey tools for customer satisfaction. This fragmented approach often misses key context that explains performance changes.
AI platforms bridge this gap by integrating internal and external data. Internal sources like call recordings and Slack conversations, combined with external inputs such as product feedback and survey results, provide richer insights into performance trends.
Take churn rate as an example. Analytics might show an increase, but without context, the reasons remain unclear. An AI system that analyzes customer support tickets, sales call recordings, and usage data together might uncover that a recent feature update is causing customer frustration. This added context turns a troubling metric into an actionable opportunity.
BuildBetter.ai demonstrates this approach by connecting team communication tools with external customer data through over 100 integrations, including Zoom, Slack, Jira, Salesforce, Zendesk, HubSpot, and Intercom. The platform processes data from call recordings, chat conversations, support tickets, and surveys to deliver a unified view of product performance.
The platform’s integration capabilities allow it to analyze different data types together. For instance, customer success calls can be transcribed and compared with support ticket trends and product usage patterns. This unified analysis can reveal correlations, like how specific onboarding conversations influence long-term customer value or how internal discussions about feature priorities align with customer feedback.
Automated Insights and Predictive Analytics
Traditional KPI analysis is often reactive and time-consuming, but AI systems provide real-time insights by continuously monitoring data streams. This allows teams to focus on strategy instead of manually compiling reports.
With automated data collection, AI platforms eliminate the need for hours of manual reporting. They pull data from various systems, process it, and generate reports automatically. This frees up teams to focus on implementing strategies rather than gathering numbers.
Real-time insights also enable teams to identify patterns early. For example, AI can flag customers at risk of churning by spotting trends in their behavior, feedback, or usage metrics. If the system notices that customers who skip engaging with a specific feature in their first 30 days are more likely to churn, it can alert teams to intervene proactively.
Predictive analytics takes this a step further by forecasting future KPI trends. Machine learning models analyze historical data to predict outcomes like customer lifetime value, churn risk, or potential revenue growth. This helps teams make informed decisions about resource allocation, feature updates, and customer success strategies.
AI also automates workflows. When certain KPI thresholds are met or patterns are detected, the system can trigger actions automatically. For instance, it might notify customer success teams about at-risk accounts, update project management tools, or generate detailed reports for stakeholders.
BuildBetter.ai adds another layer of convenience with AI-powered chat functionality. Teams can query their data in natural language, asking questions like, "What were the main reasons for customer churn last quarter?" and receiving immediate, data-driven answers.
Data Privacy and Workflow Automation
Using AI for KPI tracking requires careful attention to data privacy and security, especially when handling sensitive customer information and internal communications. Robust permission controls ensure team members only access data relevant to their roles, while compliance with regulations like GDPR, HIPAA, and SOC 2 Type 2 safeguards customer information.
AI platforms address privacy concerns through advanced security features, while also streamlining workflows. Insights are routed directly to the right stakeholders, reducing delays and the risk of missed information. Instead of manual handoffs, AI can automatically notify relevant team members, update project management tools, and schedule follow-ups.
For example, if AI identifies customer feedback themes linked to churn risk, it can automatically create tickets, alert managers, and schedule follow-ups. This ensures that insights are acted on promptly and consistently.
Integration with existing tools and workflows is another key strength. AI platforms like BuildBetter.ai work seamlessly with tools teams already use, such as Notion, Jira, and Slack. They can update documents, create tickets, or generate reports in familiar formats, minimizing disruption and making adoption easier.
BuildBetter.ai also excels in turning unstructured data into actionable deliverables. The platform can automatically generate project briefs, user personas, and analysis reports, ensuring that qualitative data is transformed into useful outputs that directly support KPI improvement efforts.
How to Choose and Act on the Right KPIs
Choosing the right KPIs can make or break your ability to drive business growth. Many B2B product teams fall into the trap of tracking an overwhelming number of metrics, which often muddies the waters rather than providing clarity. Instead, focus on a handful of meaningful KPIs that align with your business goals and growth stage.
Match KPIs to Business Goals
Your KPIs should directly tie into what your organization is working to achieve. Start by identifying your primary business objective - whether it's scaling revenue, improving customer retention, or driving operational efficiency - and then select metrics that clearly indicate progress toward that goal.
For example:
- Early-stage products benefit from tracking metrics like daily active users, feature adoption rates, or time-to-first-value. These metrics help gauge engagement and retention during initial growth.
- Growth-stage products should focus on metrics such as customer acquisition cost (CAC), customer lifetime value (CLV), and net revenue retention. These provide insights into scalability and profitability.
- Mature products often shift focus to operational efficiency and market share, complementing earlier metrics with a broader view of performance.
To ensure alignment across teams, involve key stakeholders - from sales to customer success - when selecting KPIs. This ensures everyone is working toward shared priorities.
Once you've identified the right KPIs, the next step is ensuring your data is accurate and consistent.
Maintain Data Quality and Consistency
Accurate and consistent data is the backbone of effective KPI tracking. Without it, you're at risk of making costly missteps.
- Data accuracy ensures your metrics reflect real-world events.
- Data consistency ensures uniformity across databases and tools.
Common issues like inconsistent data entry, system integration errors, or changing data classifications can disrupt your ability to track trends over time. To avoid these problems:
- Enforce strict validation rules and conduct regular automated audits to catch errors.
- Use automated checks to flag unusual patterns or outliers. For instance, if churn rates suddenly spike or drop, investigate whether it’s a genuine trend or a data glitch.
Tracking KPIs across multiple tools can complicate consistency. Different systems may define metrics like "active users" differently, leading to discrepancies. To address this, create clear documentation for each KPI, detailing:
- How it’s calculated
- Data sources
- Handling of missing data
- Any exclusions
Centralizing data using integration platforms can also help by applying uniform rules, reducing inconsistencies across reports.
Even with accurate data, your KPIs should evolve as your business and market conditions change.
Review and Update KPIs Regularly
KPIs aren’t static; they need to adapt as your product and market evolve. Scheduling quarterly reviews helps ensure your metrics stay aligned with current priorities and continue to provide actionable insights.
Different stages of a product’s lifecycle call for different metrics:
- During the discovery phase, you might track user interview completion rates or prototype feedback scores.
- Post-launch, engagement metrics and early adoption rates become more relevant.
- For mature products, metrics like retention, expansion, and competitive positioning take center stage.
External factors, such as market shifts or economic changes, may also require adjustments. For example, a downturn might shift focus from growth to retention and efficiency. Advances in technology, like AI-powered analytics, can open doors to tracking new dimensions of customer behavior, such as sentiment analysis or predictive churn.
It’s also important to let go of metrics that no longer serve a purpose. If a KPI hasn’t influenced a decision in six months, it’s time to stop tracking it. Overloading on metrics can lead to analysis paralysis, making it harder to focus on what truly matters.
Seasonal trends can also impact KPI relevance. For instance, B2B products often experience fluctuations during holidays or fiscal year-end periods. Anticipate these shifts to avoid being caught off guard by temporary changes.
When updating KPIs, try to maintain historical context. If you change how a metric is calculated, consider tracking the old version alongside the new one for a transition period. This helps preserve trend analysis while adapting to your updated measurement strategy.
Conclusion: Using KPIs to Drive B2B Product Growth
Key performance indicators (KPIs) are more than just numbers - they’re a compass for your product strategy, pointing you toward growth opportunities that might otherwise go unnoticed. But success doesn’t come from tracking every metric under the sun. It’s about zeroing in on the KPIs that align with your business goals and using them to guide meaningful action.
For B2B product teams, metrics like customer acquisition cost (CAC), customer lifetime value (CLV), churn rate, and net promoter score (NPS) work together to paint a clear picture of product health. These metrics become even more impactful when paired with high-quality data, tailored to your business’s current stage, and revisited regularly to ensure they stay relevant as your product evolves. When combined with sound data practices, a focused approach to KPIs can be a powerful driver of strategic growth.
To take this a step further, integrated platforms can turn fragmented data into actionable insights. This ensures you’re not overlooking critical information buried in customer feedback, call recordings, or support tickets.
Modern B2B product teams need tools that can make sense of unstructured data from various sources - whether it’s customer feedback, team discussions, or support interactions - and turn it into practical insights. BuildBetter stands out by consolidating call recordings, qualitative analyses, and AI-driven chat into one platform, designed specifically for teams that value actionable insights over sheer data volume.
FAQs
How can AI tools help track and analyze KPIs for B2B products?
AI tools are reshaping the way B2B product teams monitor and interpret key performance indicators (KPIs). With features like predictive analytics, real-time insights, and task automation, these tools make it easier to forecast trends, spot potential challenges, and identify actionable opportunities. The result? Faster, more precise decision-making.
By automating processes such as lead prioritization, analyzing customer feedback, and monitoring sentiment, AI frees up teams to concentrate on higher-level strategies. These tools also deliver a deeper understanding of crucial metrics like customer acquisition cost (CAC), churn rate, and customer lifetime value (CLV). This kind of insight helps teams fine-tune their performance and fuel business growth. In a competitive landscape, using AI to make data-driven decisions gives product teams the edge they need to stay ahead.
How can I ensure my KPI data is accurate and consistent?
To keep your KPI data reliable and consistent, it’s crucial to implement regular data audits. These audits help spot and fix errors before they snowball into bigger issues. Whenever possible, set up automated quality checks to catch inconsistencies and ensure updates are happening in real-time. Assigning specific data stewardship roles is another smart move - this creates clear accountability for maintaining data accuracy and integrity.
You should also monitor metrics like accuracy, completeness, and consistency using dashboards. These tools provide a clear view of your data quality over time, making it easier to base decisions on dependable insights. After all, precise data is the backbone of measuring success and driving meaningful growth.
How can a B2B product team determine the most important KPIs to track for their goals?
A B2B product team should zero in on KPIs that align closely with their business goals - whether that's boosting revenue, keeping customers loyal, or growing market share. The first step? Pinpoint measurable outcomes that clearly show progress toward these objectives.
Stick to 5-7 key KPIs to keep things focused and actionable without overwhelming the team. Some great examples include Customer Acquisition Cost (CAC), Customer Lifetime Value (CLV), churn rate, and Net Promoter Score (NPS). The key is to prioritize metrics that are specific, directly relevant to your strategy, and capable of driving meaningful decisions.