How to Generate Research Reports With Source Citations
A seven-step method for research reports where every finding links to its quote, call moment or survey response, plus a citation format and checklist.
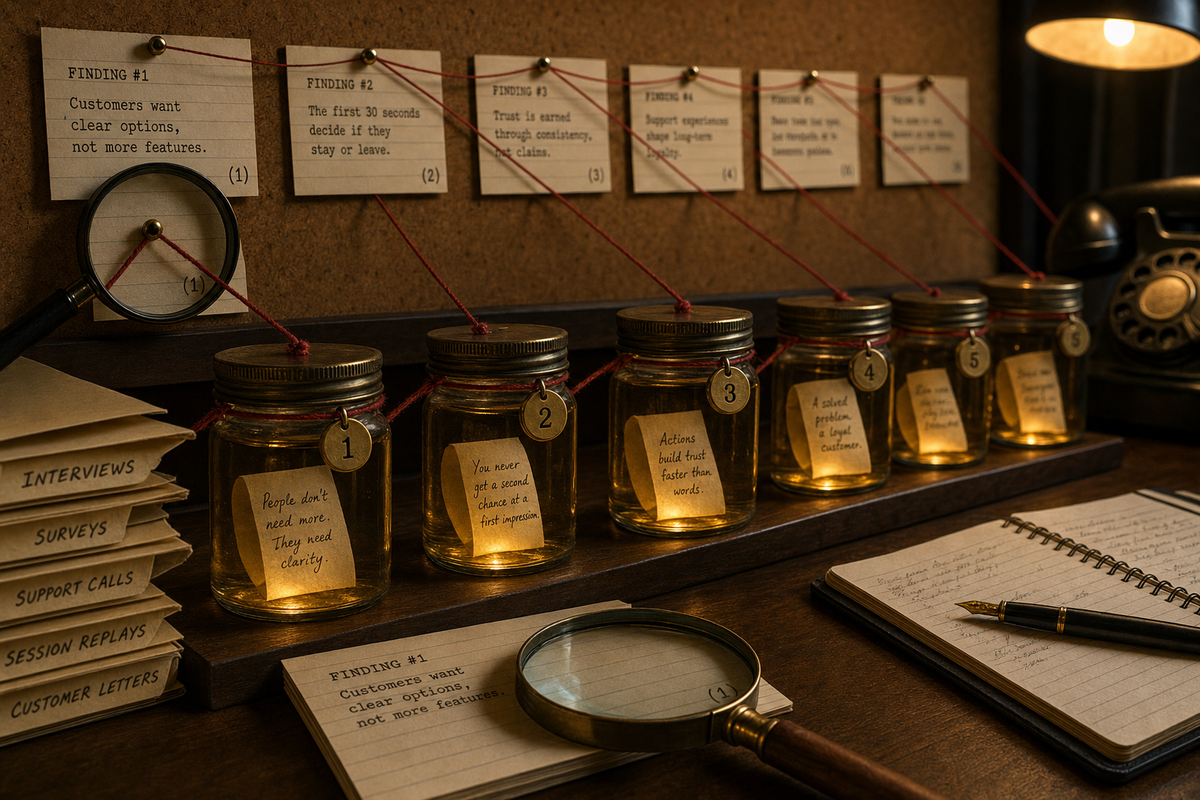
To generate a research report with source citations, tie every finding to the specific quote, call moment or survey response behind it, then check each citation before the report ships. The method works with or without software: define the question, collect and label sources, extract claims with verbatim quotes, cluster them, write findings with inline citations, verify every citation, and mark confidence and gaps. BuildBetter automates much of the extraction and linking. This guide also covers a manual spreadsheet method for teams that have no research tooling.
Why every finding should link to its evidence
A finding without a traceable source cannot be checked, challenged or reused. That is the main reason to cite. A research report is an argument that customers think or do something, and readers act on it. They change a roadmap, rewrite onboarding or escalate an account. If they cannot see the evidence, they can either trust the researcher completely or ignore the report. Neither outcome is good.
Citations fix several problems that show up in almost every research practice:
- Synthesis drift. Each step of summarizing moves you further from what people said. A participant's "I'd probably use it if exports worked" can become "customers want exports" and then "exports are a top priority." A citation lets anyone go back to the original sentence.
- Loud-voice bias. One memorable interview can shape a whole report. When each finding lists its sources, readers can see whether a theme rests on one person or on eight.
- AI summarization risk. Generated summaries can merge, overstate or misattribute what people said. Requiring a citation for every claim, and checking it, is the most practical guard against that.
- Productive disagreement. A stakeholder who disagrees with a finding can open the cited moment and argue about the evidence instead of arguing about the researcher.
- Reuse. Six months later, someone working on a related question can follow the citations back to raw material instead of starting over.
Citations also discipline the writer. If you cannot find a quote that supports a sentence, the sentence is probably your interpretation. You should label it as interpretation or remove it.
What a good citation format looks like
A good citation names the participant, the source type, the date and the exact location, and it is short enough to sit inline. A format that works for interviews, calls, surveys and tickets is:
[Participant ID · Source · Date or version · Locator]
Hypothetical examples:
- Interview:
[P07 · Interview · 2026-10-14 · 12:41], where the locator is a timestamp in the recording - Survey:
[R-0342 · Onboarding survey v2 · Q4], where the locator is the question number and the version is the survey version the respondent saw - Sales or support call:
[Acme-03 · Discovery call · 2026-09-22 · 31:05] - Ticket:
[T-88120 · Support ticket · 2026-09-30]
Use pseudonymous participant IDs rather than names. Keep the mapping to real identities in a restricted place. The version number matters for surveys. If a question was reworded partway through a study, a response to version 1 and a response to version 2 are answers to different questions, and the citation should say which.
Here is a hypothetical finding written with inline citations:
Finding 3: Admins delay inviting teammates until they trust the data import. Five of nine admins said they waited to invite colleagues until they had checked imported records by hand. "I wasn't going to put my team in front of numbers I hadn't checked" [P02 · Interview · 2026-10-09 · 08:15]. "We ran it alone for two weeks first" [P07 · Interview · 2026-10-14 · 12:41]. Survey responses point the same way [R-0342 · Onboarding survey v2 · Q4; R-0389 · Onboarding survey v2 · Q4]. Confidence: medium. The pattern holds across interviews, but all five admins came from companies with more than 200 employees.
Put the best quote inline and list the rest of the supporting citations after it. For long reports, add an evidence appendix that lists every citation per finding, so the main text stays readable.
The seven-step method
Work through seven steps in order. Each one produces something the next step needs:
- Define the research question and the decision it informs.
- Collect sources and give each one a stable ID.
- Extract individual claims, each with a verbatim quote and locator.
- Cluster claims into themes, counting participants rather than quotes.
- Write findings with inline citations.
- Verify every citation against the original source.
- Mark the confidence level for each finding and list the gaps.
Step 1: Define the question
Write one sentence that names the decision, then the question that informs it. For example (hypothetical): "We are deciding whether to rebuild onboarding for admins this quarter. What stops admins from inviting teammates in their first two weeks?" Then add scope: which customers, which time period, which sources. Also note what evidence would change your mind. A clear question tells you which quotes are relevant during extraction. Without one, you will pull everything and your clusters will be mush.
Step 2: Collect sources
List every source you will use: interview recordings, call recordings, survey exports, support tickets, community threads. Give each a stable ID. For each source, record the date, the method (interview, survey, call), how the person was recruited, and any relevant segment such as plan or company size. Keep the raw material intact and accessible. A citation is only useful if the thing it points to still exists.
Record how each participant was recruited. Customers who answered an in-app prompt, people who came from a research panel and accounts in an active sales cycle will say different things. Readers need to know which group a quote came from.
Step 3: Extract claims with quotes
Go through each source and pull out atomic claims. One claim is one idea from one person. For each claim, capture:
- The verbatim quote, unedited except for removing filler words. Mark any edits with brackets or ellipses.
- The locator (timestamp, question number, ticket ID).
- Your one-line paraphrase of the claim.
- Whether the statement was prompted (answering a direct question) or unprompted (raised by the participant).
- Whether it describes behavior ("we exported to a spreadsheet every Friday") or opinion ("exports should be easier").
Behavioral, unprompted statements are usually stronger evidence than prompted opinions. Capturing the distinction now saves you from overstating findings later.
Step 4: Cluster
Group claims by meaning, not by keyword. "I didn't trust the numbers" and "I checked every row by hand" belong together even though they share no words. Name each cluster with a full sentence describing the pattern, such as "Admins verify imported data before inviting others," rather than a label like "Data trust."
For each cluster, count distinct participants, not quotes. One talkative person can produce six quotes on the same topic. Also record dissent: claims that contradict the cluster. A theme with no counter-evidence at all is worth a second look.
Step 5: Write findings with inline citations
Each finding needs four parts: a one-sentence claim, the supporting evidence with at least one inline quote, the full citation list, and the implication for the decision from Step 1. Aim for several citations per finding drawn from different participants. If a finding rests on a single person, you can still report it, but say so plainly.
Keep interpretation visibly separate from evidence. A sentence like "This suggests the import flow is the real onboarding bottleneck" is fine. Label it as your reading, not as something participants said.
Step 6: Verify each citation
Open every cited source and confirm four things:
- The quote is accurate.
- The locator points to the right place.
- The surrounding context does not change the meaning.
- The quote actually supports the claim it is attached to.
Context errors are the most common problem. A participant may say "I'd never pay for that" and then, thirty seconds later, "unless it replaced our current tool."
Ideally, someone other than the author does this check, even on a sample of citations. If your report was drafted with AI help, verification is not optional. It is the step that turns a generated draft into a research report.
Step 7: Mark confidence and gaps
Give each finding a confidence label, and define the labels in the report. Hypothetical definitions:
High means the pattern appears across multiple sources and segments with little counter-evidence. Medium means it is consistent but limited to one segment or one source type. Low means it is a signal from a few participants and worth investigating further.
Then write a short gaps section. Cover who you did not hear from, which questions went unanswered, and where sources disagreed. If any input came from synthetic personas, label those findings separately. Synthetic responses are useful for first reads and pressure tests, but they are not evidence of what real customers think.
How BuildBetter generates cited reports
The platform handles Steps 2 through 5 largely automatically for research run inside it, and keeps citations attached to the underlying answers. According to the Research product page, each study ends in a report with an executive summary, key findings, and themes backed by participant quotes. You can save the report to Knowledge to share it with your team. Completed survey responses are extracted into signals "with citations back to the exact answer," alongside signals from calls, tickets and documents.
The parts that map to the method above:
- Collecting sources. AI-moderated video and audio interviews each land as a recording with a full transcript and extracted signals. Surveys can go out by branded email, public link or an in-app widget, with the same survey and the same results across channels. Typeform and Pendo surveys sync in, and integrations exist for SurveyMonkey, SurveySparrow and Survey Planet.
- Recruiting with visible criteria. With signal-led targeting, you describe the audience in plain language. The platform turns that into editable filters over your existing signals and shows each matched person with the evidence that matched them. You approve the list before anything is sent. This gives you a documented record of how participants were selected, which is useful context for Step 7.
- Stable versions for citation. Questions are versioned and immutable once sent. Editing creates a new version without changing what in-flight respondents see, so a cited answer always maps to the exact wording the respondent saw.
- Follow-ups that improve evidence. When a survey answer is thin, a model decides whether one clarifying question is worth asking, and often decides it isn't. AI interviewers ask follow-ups instead of reading the next scripted line. You set how far they probe.
- Drafting. BoB, the platform's agent, can draft a study. It writes the questions, picks the audience and sets rewards, then saves the study as a draft for your review.
For ongoing reporting beyond individual studies, the Intelligent Reports page describes a beta feature. It delivers AI analysis of your signals by email or Slack on a daily, weekly or monthly schedule. BuildBetter says these reports include statistical anomaly detection, customer quotes, period-over-period comparison and recommended actions. Example report types listed on that page include a weekly customer voice digest, competitor mentions, a feature request digest and churn risk signals.
Synthetic Personas are generated from your real signals, calls and feedback, with citations to the signals that shaped each profile. They are useful for testing a question set or a concept before you spend time with real participants. They do not replace talking to customers, so keep their output out of your findings, or clearly labeled.
Automation does not remove Steps 6 and 7. Open the cited answers, check the context, and assign confidence yourself. For a broader look at where AI fits in research work, see how to use AI for user research. For report tooling specifically, see the 2026 guide to user research report generators.
On cost, survey activity is billed in credits (1 credit = $0.001), per the product facts: 4 credits per invitation sent, 8 per completed response, 1 per AI follow-up and 4 per signal generated. A completed email response with two follow-ups and three signals comes to about 26 credits, roughly $0.026. Previews and test responses are not billed, and activation shows the estimated maximum credit exposure before sending. Details are in the documentation.
The manual spreadsheet method
A spreadsheet with four tabs can support all seven steps with no special tooling. It is slower, but the discipline is the same, and many teams start this way.
Tab 1: Sources. One row per source: Source ID, type, date, participant ID, segment, recruitment channel, link to the raw recording or export, and survey version if applicable.
Tab 2: Evidence. One row per atomic claim. This is where most of the work happens. Suggested columns:
- Evidence ID (for example, E-0001)
- Source ID (links back to Tab 1)
- Participant ID
- Verbatim quote
- Locator (timestamp, question number, ticket ID)
- Link to the exact moment, if your recording tool supports timestamp links
- Paraphrase
- Prompted or unprompted
- Behavior or opinion
- Cluster (filled in during Step 4)
- Verified (yes/no, filled in during Step 6)
- Verifier initials and notes
Tab 3: Clusters. One row per theme, with the theme sentence, a count of distinct participant IDs (a unique-count formula over the Evidence tab filtered by cluster), a count of contradicting evidence rows, and the segments represented.
Tab 4: Findings. One row per finding, with the claim, the Evidence IDs that support it, the confidence label and the implication. When you write the report, pull the citation details for each Evidence ID from Tab 2.
Practical tips: freeze the header row, use data validation for the prompted, behavior and verified columns, and never edit a quote after verification without resetting the verified flag. If several people extract claims, have each person code one or two of the same transcripts first and compare results. Disagreements about what counts as one claim are much easier to settle early.
Tool-generated versus manual citations compared
Both approaches can produce a well-cited report. The difference is how much of the linking work you do by hand, and how easy it is to keep citations intact as the evidence base grows.
| Aspect | BuildBetter | Manual spreadsheet |
|---|---|---|
| Extracting claims | Interviews and completed survey responses are extracted into signals automatically | Researcher reads each source and creates rows by hand |
| Citation links | Signals cite the exact answer; interviews include recording and transcript | Locators typed by hand; deep links depend on your recording tool |
| Survey wording changes | Questions versioned and immutable once sent | Version tracked manually in the Sources tab |
| Cross-source evidence | Research signals sit next to calls, tickets and documents | Separate exports combined manually |
| Report drafting | Study reports with summary, key findings and quote-backed themes | Written from the Findings tab |
| Verification and confidence | Still a human step | Human step, tracked in Verified column |
| Cost | Credit-based billing for survey activity; unlimited seats on every plan | Spreadsheet software plus researcher time |
Review checklist before you share the report
Run this checklist on every report before it goes to stakeholders. It takes less time than fixing a bad decision.
- The research question and decision appear at the top of the report.
- Every finding has at least one inline quote and a full citation list.
- Every citation follows the same format and includes a locator.
- Survey citations include the version the respondent saw.
- Participant counts are distinct people, not quote counts.
- Each finding lists whether it rests on one segment or several.
- Contradicting evidence is reported, not dropped.
- Every citation was opened and checked, or a stated sample was checked by a second reviewer.
- Interpretation is visibly separated from what participants said.
- Each finding has a defined confidence label.
- A gaps section names who was not heard from and what remains open.
- Any synthetic persona output is labeled and kept separate from customer evidence.
- Raw sources are accessible to readers who have permission to see them.
- Participant identities are pseudonymized in the report.
Frequently asked questions
These answers cover the questions that come up most often when teams start citing their research.
How many citations should each finding have?
There is no fixed number. A finding should cite enough distinct participants for readers to judge how widespread the pattern is. Put one strong quote inline and list the rest. If a finding rests on one participant, cite that person and label the finding low confidence.
Should I cite paraphrases or only verbatim quotes?
Use verbatim quotes as the evidence and your paraphrase as the claim. Readers need to see the participant's own words to judge whether your paraphrase is fair. If you trim a quote, mark the cut with an ellipsis and make sure the trim does not change the meaning.
Can AI-generated reports be trusted if they include citations?
Citations make AI-drafted reports checkable, not automatically correct. Open the cited sources, confirm each quote supports its claim in context, and assign confidence yourself. Treat the generated report as a draft until that verification is done.
Can BuildBetter cite survey responses and interviews in the same report?
Yes, according to its Research page. Completed survey responses are extracted into the same signals as calls, tickets and documents, with citations back to the exact answer. Interviews land as recordings with transcripts and extracted signals, so evidence from both can support the same theme.
Where do synthetic personas fit in a cited report?
Use them before fieldwork to test questions or concepts. Do not use them as evidence for findings about real customers. If you include persona results, put them in a separate, clearly labeled section.
Start citing your next study
Pick one upcoming study and apply the seven steps, even if you only use the spreadsheet template above. If you want interviews, surveys and quote-backed study reports in one place, with every signal citing the answer behind it, start free with BuildBetter Research and run your next study there.