How to Analyze Customer Feedback at Scale With AI (2027 Method)
A 7-step method to classify customer feedback with AI: fixed taxonomy, blind 5% audit, and ranking by accounts and ARR. Includes a worked example.
Your product team gets 5,000 or more pieces of feedback a month: support tickets, call transcripts, NPS verbatims, app reviews and Slack threads. The quarterly 'top themes' deck is still built from whatever someone happened to read that week. This guide gives you a repeatable, auditable method you can run in a spreadsheet with any general-purpose language model. It then shows where a platform like BuildBetter takes over once volume and source count outgrow manual work. The method draws on codebook thematic analysis and inter-rater reliability, two well-established techniques from qualitative research, adapted for B2B SaaS teams with 50 to 1,000 accounts.
What Analyzing Customer Feedback at Scale With AI Actually Means
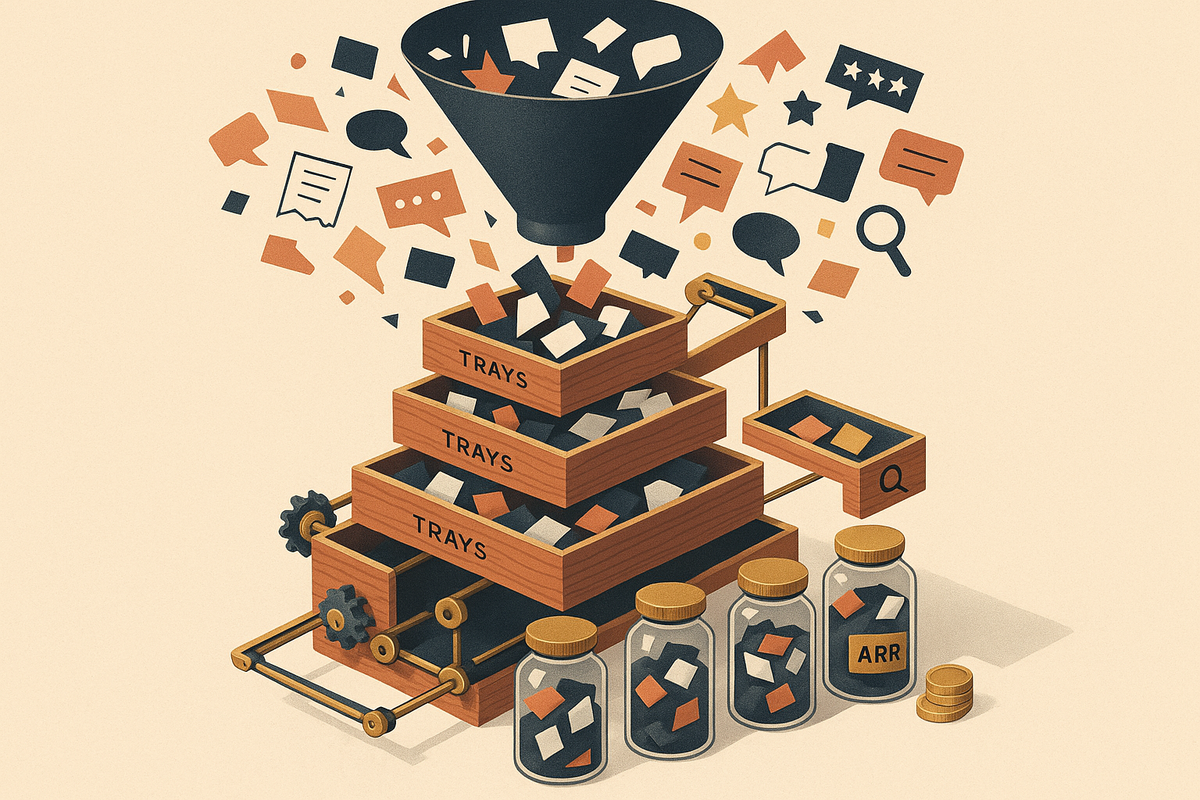
Analyzing customer feedback at scale with AI means classifying every piece of feedback from every source against a fixed, human-built list of themes, using a language model to do the classification. Humans check a random sample to verify accuracy. Each theme is then ranked by how many accounts and how much revenue it affects, not just by how often it is mentioned.
That definition rules out several things teams often call AI feedback analysis:
- Pasting a dump into a chatbot and asking it to 'summarize the themes.' You get a different list on each run, with no counts tied to specific items.
- Sentiment scoring on its own. Knowing that 38% of tickets are 'negative' tells you nothing about what to build.
- Word clouds. They measure vocabulary. They don't measure problems.
A working voice of customer (VoC) program produces three outputs every cycle:
- A ranked theme list with three numbers per theme: mentions, distinct accounts and ARR affected.
- Trend versus the last period, which is only possible because the theme list stays fixed.
- Verbatim evidence for each theme, linked to the account and the original conversation.
The rest of this page covers a 7-step method that a team with a spreadsheet and no budget can run this week. It also includes a worked example with numbers and an honest threshold for when tooling becomes necessary.
Why Feedback Analysis Breaks as Volume Grows
Feedback analysis rarely fails because of volume alone. It fails because the classification scheme changes every cycle and nobody checks the output. As volume grows, the following failure modes add up:
- Fragmentation. Feedback sits in five or more systems with different formats. Nobody sees all of it, so the loudest channel wins. That is usually the support queue or the last big call.
- Recency and availability bias. The deck reflects what the PM read recently, not what is most frequent or most costly.
- Misleading mention counts. One frustrated power user who files 40 tickets outranks 30 enterprise accounts that each raise a problem once on a call.
- Lost provenance. Once a quote is copied into a slide, its link to the account, date and source is gone. Nobody can verify it or follow up with the customer.
- Theme drift between periods. Themes get renamed or re-split each quarter, so nobody can answer 'is this getting better or worse?'
- Naive AI use makes all of this worse. A general chatbot asked 'what are the themes?' returns a different list on each run. It can silently truncate long inputs. It may paraphrase quotes into words the customer never said. Its themes come with no counts tied to specific rows.
There is also a technical reason for the inconsistency. Hosted LLMs are not fully deterministic even at temperature 0, because batching and floating-point effects change outputs slightly between sessions. The same prompt can return different labels on Tuesday than it did on Monday.
AI makes classification cheap. It only makes it trustworthy when the scheme is fixed and the output is audited, and that is what the method below provides.
The Method: 7 Steps to Analyze Customer Feedback at Scale With AI
This method is a hybrid of inductive and deductive coding. You build the codebook from a hand-coded sample, then apply it at scale with an LLM. It maps onto the 'generating codes' and 'reviewing and defining themes' phases of Braun and Clarke's thematic analysis. You need a spreadsheet and any general-purpose model. No specific product is required.
Step 1: Inventory every source and its monthly volume
List each channel: support tickets, call transcripts, NPS/CSAT verbatims, app store reviews, sales notes, Slack and community threads, and churn surveys. For each one, record the owner, the export method and the approximate number of items per month. The output is a one-tab source inventory. Most teams find at least one source they had forgotten, usually CSM Slack channels or sales call notes. If your sources are scattered, start with our guide on how to consolidate customer feedback from Slack, support and surveys.
Step 2: Normalize everything into one table
Every row needs these columns: item_id, text, source, account_id/account_name, date, ARR (or plan tier) and link_to_original.
- Put one feedback item on each row. Split long calls so each distinct request or complaint gets its own row.
- Strip signatures, disclaimers and boilerplate.
- Join ARR from your CRM by account ID.
The account and ARR columns matter more than any AI step. Without them, you can count mentions but you can't see breadth or revenue at stake. That is the gap that causes teams to fix the wrong problem.
Step 3: Build a starting taxonomy of 15–25 themes from a 200-item hand-coded sample
Pull a random sample of 200 items, proportional to each source's share of volume. Two people tag the sample independently, then reconcile their differences. Write each theme with a name, a one-sentence definition, an 'includes' example and an 'excludes' example. Add an explicit 'Other / unclear' bucket.
Why 15 to 25 themes? With fewer, distinct problems get merged and hidden. With more, classification becomes unreliable and reports become unreadable. Use two levels at most, for example 'Onboarding > SSO setup'.
| Theme | Definition | Includes (example) | Excludes (example) | Owner |
|---|---|---|---|---|
| SSO & provisioning | Failures or gaps in single sign-on, SCIM user sync or deprovisioning | 'Users removed in Okta still have access' | Password reset requests (goes to Account access) | Platform PM |
| Notification noise | Too many, irrelevant or duplicate alerts and emails | 'I get 30 emails a day for comments I don't care about' | Missing notifications (goes to Notification reliability) | Collaboration PM |
| Reporting exports | Problems exporting reports or data out of the product as files | 'CSV export drops the custom fields' | Syncing data to a warehouse or BI tool (goes to Data integrations) | Analytics PM |
Step 4: Let AI classify the rest against that taxonomy and flag low-confidence items
Run zero-shot or few-shot classification with the full codebook in the prompt. A workable structure looks like this:
You are classifying B2B customer feedback.
TAXONOMY (v1.0):
[Theme name] | [Definition] | Includes: [...] | Excludes: [...]
... (all themes, plus 'Other / unclear')

For each row, return: item_id | theme | confidence (high/medium/low) | supporting_phrase
Rules:
- Choose exactly one theme, or 'Other / unclear'.
- supporting_phrase must be copied verbatim from the input text. Do not paraphrase.
- If no theme clearly fits, use 'Other / unclear' with confidence 'low'.

ROWS:
[item_id] | [text]
...
Work in batches of 50 to 100 rows so nothing gets truncated. Paste the results back into the sheet and match them by item_id. Send every 'low' confidence item and every 'Other' item to a human review queue. As a rule of thumb, if more than about 10% of items land in 'Other', your taxonomy is missing a theme.
Step 5: Audit a random 5% sample by hand every cycle and track agreement
A human codes a random 5% of items blind, without seeing the AI label, then compares the two. Use 5% or 100 items, whichever is larger, because samples below about 100 give agreement estimates too noisy to act on. Blind coding matters. A coder who sees the AI label first will anchor on it and inflate agreement.
Track percent agreement every cycle and aim for 85% or higher. That sits above the roughly 80% minimum McHugh (2012) cites for health research. You can also report Cohen's kappa, which corrects for chance agreement; Landis and Koch (1977) treat 0.81 and above as 'almost perfect.' Use kappa as a secondary metric only. When one category dominates, kappa can look low even when raw agreement is high, a problem known as the 'kappa paradox.' Teams with more than two coders can use Krippendorff's alpha, where 0.800 or higher is considered reliable.
When agreement drops, fix the theme definitions, not the individual labels. Disagreements usually cluster between two overlapping themes. Version the taxonomy like code (v1.0, v1.1) and keep a changelog with the date, the change and the reason. When you split or merge a theme, either re-run the prior period against the new version or footnote the trend as not directly comparable.
Step 6: Quantify each theme three ways
Each theme gets three numbers, and each one answers a different question:
- Mentions measure the volume of pain. In Google Sheets or Excel, use
COUNTIF(theme_col, "X"). - Distinct accounts measure breadth. In Google Sheets, use
COUNTUNIQUEIFS(account_col, theme_col, "X"). In Excel 365, use=COUNTA(UNIQUE(FILTER(account_col, theme_col="X"))). In older versions of Excel, build a pivot table, tick 'Add this data to the Data Model' and choose 'Distinct Count'. - ARR affected measures revenue at stake.
One detail breaks most spreadsheets: sum ARR across distinct accounts, not across rows. If a $200K account mentions SSO 12 times, a naive SUMIFS over rows reports $2.4M. Instead, build a deduplicated theme × account table first (for example, UNIQUE on the two columns), then run SUMIFS on that table.
Step 7: Report trend versus last period with two verbatim quotes per theme
Give each theme one row. Show this period versus last period for all three numbers, a direction arrow, and two verbatim quotes with the account name and a source link. Quotes must be copied exactly from the source and never paraphrased by the model. Keep the report to one page. Any theme that moves three or more places in rank gets one sentence explaining why.
Why a fixed taxonomy plus sampled audit beats asking a chatbot 'what are the themes?'
- Stability: A fixed taxonomy gives you categories you can compare month to month. Ad-hoc prompts produce a new list on every run.
- Traceability: Every count traces back to specific rows. Chatbot totals can't be verified.
- Measured accuracy: The audit gives you an agreement figure. With ad-hoc prompts, the error rate is unknown.
- Weighting: Account and ARR weighting is possible because each label sits on a row with an account. A pasted dump has no account data.
The chatbot still does the work. It acts as the classifier, and humans act as the analyst. Peer-reviewed research supports this split. Gilardi, Alizadeh and Kubli (PNAS, 2023) found that ChatGPT's zero-shot annotation beat crowd workers on four of five tasks at roughly $0.003 per label, using predefined categories.
Time estimate: Setup (Steps 1–3) takes roughly 1–2 working days. After that, each monthly cycle takes a few hours at modest volume.
Worked Example: One Month of Feedback at a 300-Account SaaS Company
This is an illustrative composite scenario, not a customer case study. It shows how the three-number ranking changes a real prioritization decision.
Setup: The company has 300 B2B accounts and about $12M in total ARR. In one month it received 6,200 feedback items:
- 2,400 support tickets
- 1,300 NPS verbatims
- 900 call-transcript excerpts
- 900 Slack and community messages
- 700 app reviews, counted for mentions only because they have no account link
Taxonomy and classification: The team built 22 themes plus 'Other' from a 200-item hand-coded sample. AI classification put 7% of items into 'Other' and flagged 9% as low-confidence for human review.
Audit: A PM blind-coded 310 items (5%), and 282 matched the AI label, for 91% agreement. Most disagreements fell between 'Reporting exports' and 'Data integrations'. The team tightened both definitions and moved the taxonomy to v1.1.
| Theme | Mentions | Rank by mentions | Distinct accounts | ARR affected | Rank by ARR |
|---|---|---|---|---|---|
| Notification noise | 780 | 1 | 140 | $0.9M | 6 |
| Reporting exports | 610 | 2 | 95 | $1.6M | 2 |
| Data integrations | 520 | 3 | 88 | $1.4M | 3 |
| Dashboard performance | 470 | 4 | 110 | $1.2M | 4 |
| Billing & invoices | 390 | 5 | 70 | $0.6M | 7 |
| Permissions & roles | 300 | 6 | 45 | $1.1M | 5 |
| SSO & SCIM provisioning failures | 240 | 7 | 18 | $1.9M | 1 |
ARR totals overlap across themes because one account can appear under several themes.
Why SSO was invisible before: Enterprise admins raised SSO and SCIM problems on calls and through their CSM in Slack. They rarely used the ticket queue, and the old deck was built from tickets alone. Eighteen accounts worth $1.9M were affected, and nobody had seen the pattern.
The decision:
- Pull the SSO/SCIM fix into the next sprint.
- Have CS contact all 18 affected accounts directly with a timeline.
- Defer the notification redesign one quarter, but ship a quick digest setting as a mitigation.
- Watch next month: SSO mentions and affected accounts should fall, and notification mentions should not rise.
The method changed the decision, not just the deck. Ranking by mentions alone would have sent engineering to the wrong problem.
Common Mistakes When Analyzing Feedback With AI
Most failed feedback programs make the same handful of errors, and each one can be prevented.
- Letting the AI invent the taxonomy every cycle. Periods become incomparable, so any trend you report is guesswork.
- Ranking by mentions only. This over-weights vocal small accounts and noisy channels.
- Skipping the audit. You can't state your accuracy, and errors compound without anyone noticing.
- Accepting paraphrased 'quotes'. Models smooth wording into things customers never said. Require verbatim spans and source links.
- Over-splitting themes (40 or more). Every theme looks small, so nothing reaches the roadmap.
- Treating sentiment scores as the insight. 'Negative' doesn't tell you what to build.
Some problems no tool fixes, including BuildBetter:
- Survivorship bias. Customers who churn quietly never file tickets, so feedback over-represents engaged users. Pair it with usage and churn data.
- Weak inputs. Leading survey questions produce biased verbatims that no classifier can correct.
- No owner. Without a named person maintaining the taxonomy and running the audit, any system decays within a few cycles.
- No loop closure. When analysis never leads to a decision or a reply to the customer, customers learn to stop giving feedback.
When You Need Tooling (and Which Tools to Consider)
The honest threshold
A spreadsheet plus a general chatbot handles roughly 500 feedback items a month comfortably. Past that point, two things break first:
- Re-classification drift. Batches classified in separate sessions get labeled inconsistently, and re-running after a taxonomy change becomes a full day of copy-paste.
- Lost source links. Exports, copies and manual joins break the chain from quote to account to original conversation.
| Signal | Manual still works | Time for tooling |
|---|---|---|
| Monthly volume | Under 500 items | 500+ items |
| Number of sources | 1–3 | 4+, especially calls and Slack |
| ARR join | One CRM export per cycle | Frequent account and plan changes |
| Audit agreement | Stable at 85%+ | Dropping as volume grows |
| Refresh cadence | Monthly | Weekly or live |
Tools worth evaluating
The ranking below fits the method above. For a fuller breakdown, see our comparison of the best tools to analyze customer feedback at scale.
| Tool | Sources | Custom taxonomy + verbatim links | ARR / account weighting | Best fit |
|---|---|---|---|---|
| BuildBetter | Calls, Slack, tickets, surveys, CRM (100+ integrations) | Yes | Yes | B2B product teams with high-value feedback in calls and Slack |
| Savio | Support and sales tools | Feature-request focused | Yes | Feature request prioritization |
| Viable | Text feedback | Summary reports | Limited | Quick written theme reports |
| Zonka Feedback | Surveys and feedback channels | Built-in text analytics | Limited | Teams that also run CSAT/NPS surveys |
1. BuildBetter. BuildBetter pulls in call recordings, Slack, support tickets and surveys through 100+ integrations, including Zoom, Slack, Zendesk, Intercom, HubSpot, Salesforce and Jira. Signals analyzes each item individually for severity and business impact. Taxonomy applies your own codebook. Clusters groups items into themes, and every theme links to the verbatim quote and the account. It also turns themes into PRDs, Jira or Linear tickets, and loop-closure emails. Best fit: B2B product teams whose most valuable feedback lives in calls and internal Slack, not just tickets.
2. Savio. Centralizes feature requests from support and sales tools and ties them to customer revenue. Best fit: teams focused mainly on feature request prioritization.
3. Viable. LLM-based analysis of text feedback with natural-language summary reports. Best fit: teams that want quick written theme reports from support and survey text.
4. Zonka Feedback. Survey and feedback collection with built-in AI text analytics. Best fit: teams that also need to run CSAT/NPS surveys across channels.
Each category has limits. If your main need is enterprise-scale survey distribution, a dedicated survey platform is the better choice. If you are mining millions of public reviews, a specialist review-NLP engine goes deeper. If you need a research repository with highlight reels, a dedicated research tool is more mature. Whichever tool you choose, keep Steps 3, 5 and 6 of the method: a fixed taxonomy, a sampled audit and ARR weighting.
FAQ: Analyzing Customer Feedback at Scale With AI
Can ChatGPT or Claude analyze customer feedback at scale?
Yes, as a classifier, not as the analyst. Give the model a fixed taxonomy with definitions and include/exclude examples. Classify in batches of 50–100 items, require a verbatim supporting phrase for each label, and blind-audit a random 5% (minimum 100 items). Asking a chatbot to 'find the themes' in a pasted dump produces a different list on each run, may truncate input, and gives counts you can't verify.
How many themes should a customer feedback taxonomy have?
Start with 15–25 themes built from a hand-coded sample of about 200 items, plus an 'Other / unclear' bucket. Use at most two levels. If more than about 10% of items land in 'Other', add a theme. If two themes are constantly confused in the audit, merge or redefine them.
How accurate does AI feedback classification need to be?
Aim for 85% or higher agreement between AI labels and a blind human audit. That is above the roughly 80% minimum often cited in research, such as McHugh (2012). Below 85%, fix the theme definitions before trusting any counts. Audit at least 100 items, because smaller samples give margins of error of ±10 points or more.
What is the difference between percent agreement and Cohen's kappa?
Percent agreement is the share of items where the AI and the human chose the same theme. Cohen's kappa adjusts for agreement that would happen by chance. Kappa above 0.80 is conventionally rated 'almost perfect' (Landis & Koch, 1977). With many themes and one dominant category, kappa can look low despite high agreement, so track percent agreement as the main metric.
Should customer feedback be weighted by revenue?
Report mentions, distinct accounts and ARR side by side. A theme can rank seventh by mentions and first by ARR. Revenue weighting surfaces problems concentrated in large accounts that rarely file tickets. Always sum ARR across distinct accounts, not rows, or repeat mentions will inflate the total.
How often should feedback analysis be run?
Monthly is enough for most B2B teams under 500 items a month. Weekly or continuous analysis becomes worthwhile once volume, source count or release cadence makes monthly trends too slow to act on.
At what volume does manual feedback analysis stop working?
Around 500 items a month. Beyond that, inconsistent re-classification across batches and broken links between quotes and accounts make a spreadsheet-plus-chatbot setup unreliable.
Sources and Further Reading
- Thematic analysis: the qualitative method behind taxonomy building (Braun & Clarke, 2006)
- Inter-rater reliability: the basis for the audit step
- Cohen's kappa: optional agreement statistic for Step 5
- Net promoter score: context for NPS verbatims as a source
- Gilardi, Alizadeh & Kubli, 'ChatGPT outperforms crowd workers for text-annotation tasks', PNAS, 2023
- Törnberg, 'ChatGPT-4 Outperforms Experts and Crowd Workers in Annotating Political Twitter Messages with Zero-Shot Learning', arXiv, 2023
- McHugh, 'Interrater reliability: the kappa statistic', Biochemia Medica, 2012
- Landis & Koch, 'The Measurement of Observer Agreement for Categorical Data', Biometrics, 1977
- Related guides: How to consolidate customer feedback from Slack, support and surveys and Best tools to analyze customer feedback at scale
Make Churn Optional
The method above works in a spreadsheet. Once your feedback spans calls, Slack, tickets and surveys across hundreds of accounts, BuildBetter runs the same discipline continuously. It applies your taxonomy to every signal, links each theme to verbatim quotes and the ARR behind them, and turns the result into PRDs, tickets and customer follow-ups. It is SOC 2 Type II, HIPAA and GDPR compliant.
Make churn optional. Book a demo to see your own feedback ranked by accounts and revenue.